

Summary: Learning and using Google APIs for the first time
My summer ‘22 project to better inform the local community.


Living on Cape Cod, Massachusetts it is difficult to ignore all of the shark sightings and stories on the news everyday. Even with all this news coverage, there are no easily accessible public data logs of shark sightings on Cape Cod. As a Computer Science student with a passion for information management and data analytics, I thought of a personal project to bridge the two together. I spent my time this summer creating an application to take in community user supplied input of local shark sightings to first create a data log. Using this data, I developed a second program to interpret and translate this community data into a user friendly interactive heat map.
Going into this project I had the definitive goal of learning something new and to gain experience and skills. I went through an in depth planning and design process of how I wanted to efficiently collect and display this data. I ultimately decided on leveraging a third party Google API to help present a visual of my data log. Going into this portion of my project I had no prior experience with APIs or how to use them, so this effort would be a great learning experience.
I first worked to create the interface for this application using Python. This application allows the user to input data for shark sightings by selecting the town and beach for that sighting, as well as capturing the date of the event.
Interface shown below.
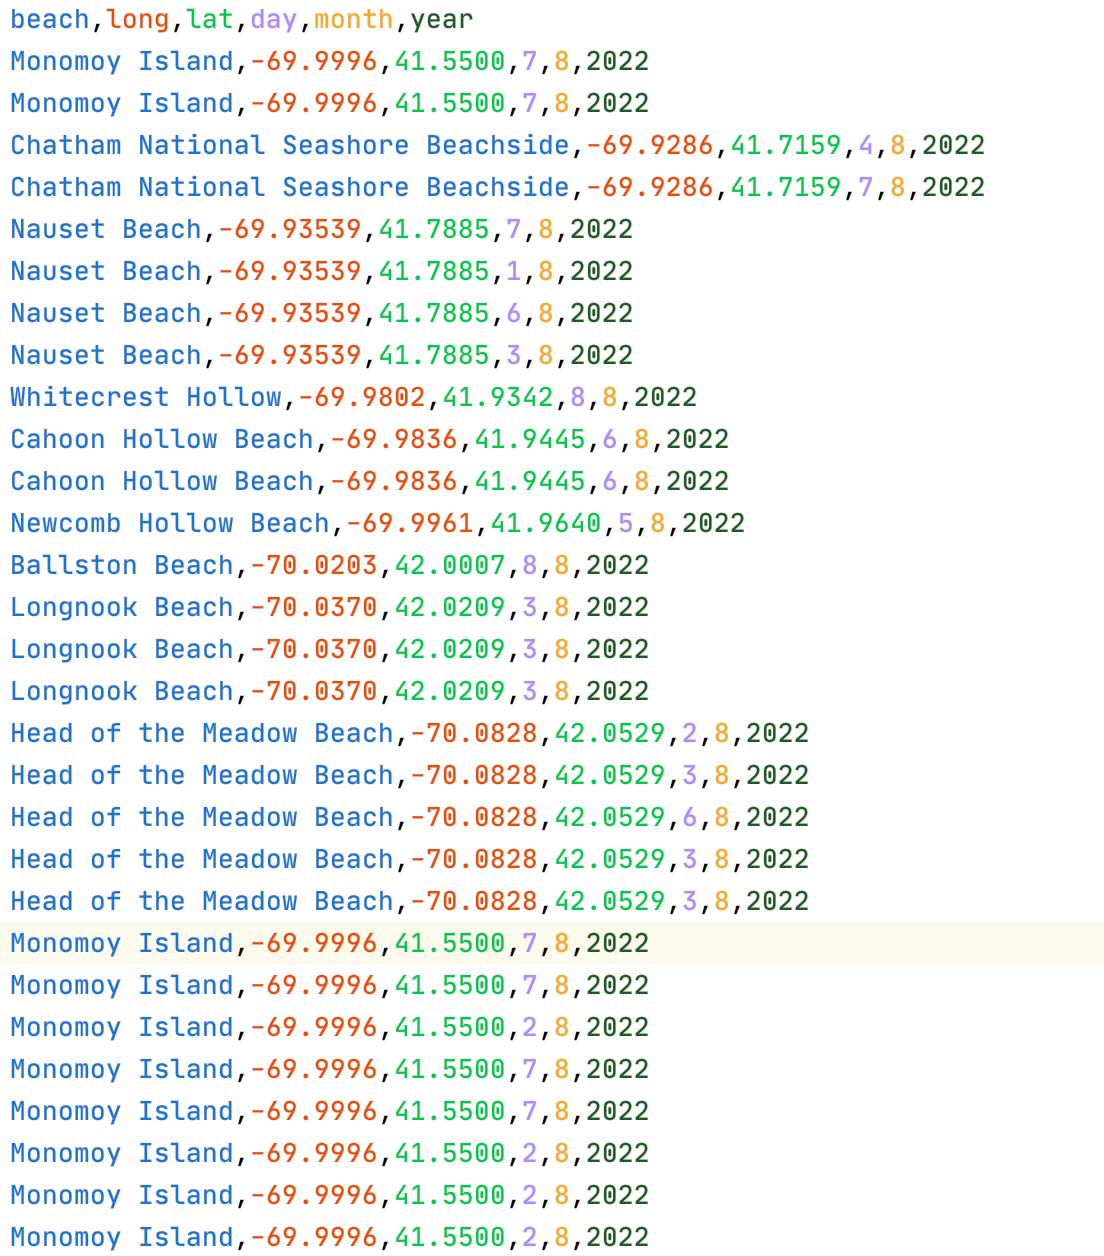
After the user inputs their sighting data, the information and coordinates are logging into a .csv file. The .csv file stores each sighting’s corresponding beach name, latitude, longitude, and date of the sighting.
Here is a real sample data set from all sightings on Cape Cod within a week of August 8, 2022.
I taught myself how to search, locate, and use the API to bridge my application’s community input data to a heat map. I used Python in Jupyter Notebook to create the program to ingrate the .csv file data into the Google API to create the visualization.
The experience opened my eyes to the world of external APIs, and how to integrate them into ones work. Therefore, I am very satisfied with my first experience with APIs.
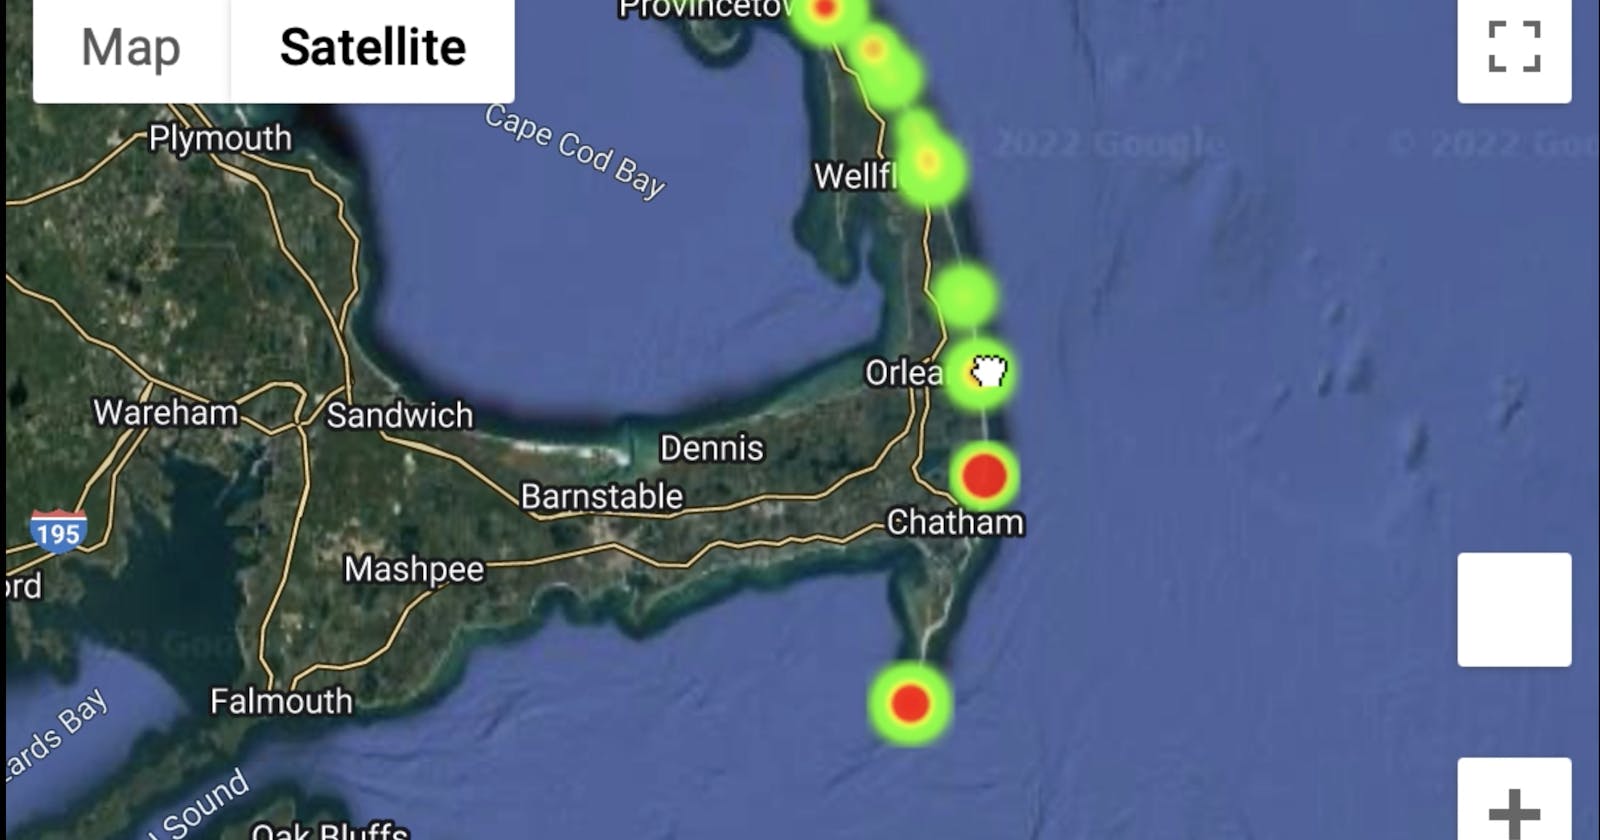
Final visualization shown below.
Data logged and visualized is real data from all sightings on Cape Cod within a week of August 8, 2022.
One should not rely on this application to determine if it is safe to swim.